Why birds show up
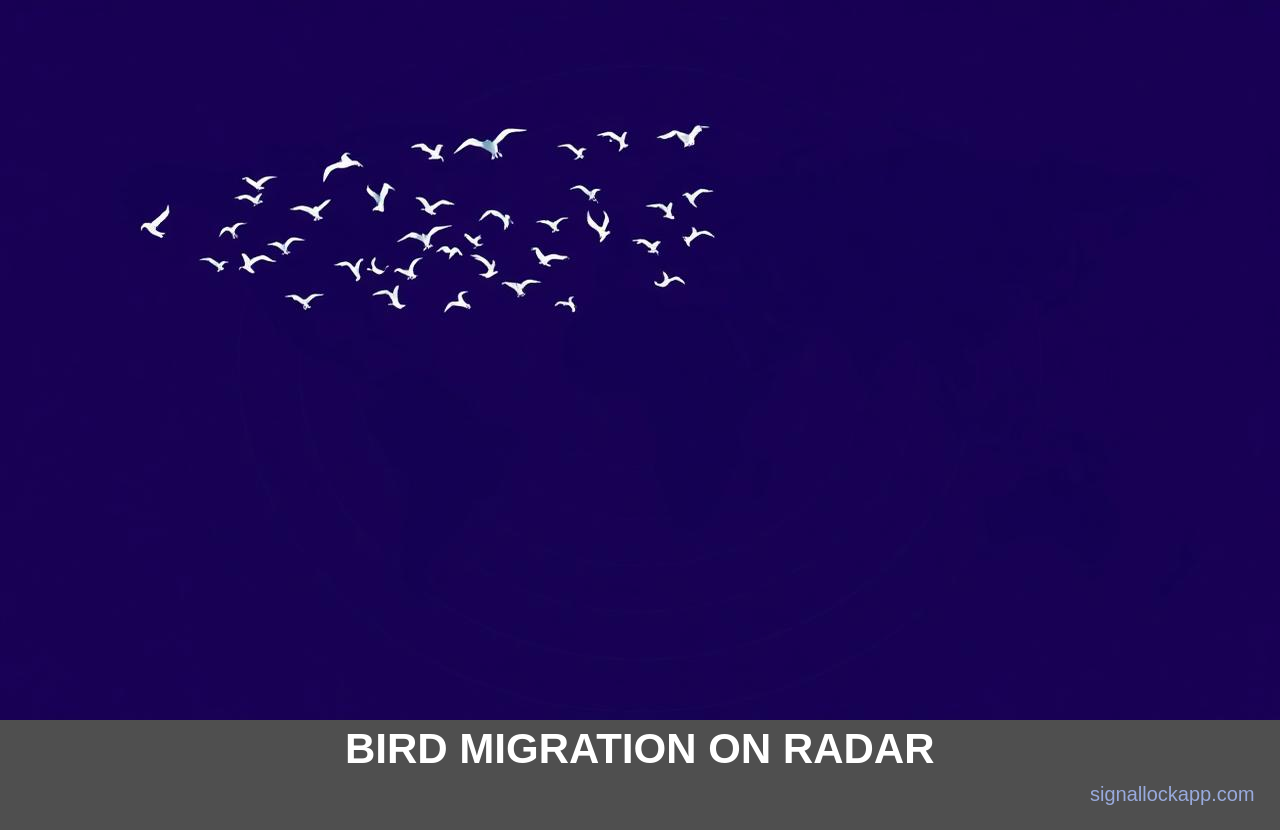
A migrating songbird is roughly the size of a 5 cm water droplet — large enough to reflect S-band weather radar. At peak migration, dense flocks return enough energy to look like a light rainstorm. Dual-pol lets researchers tell birds from rain — the polarisation signature differs.
BirdCast and the AI layer
The Cornell Lab of Ornithology's BirdCast project runs ML models on live NEXRAD data, producing nightly migration maps and 3-day forecasts. Cities use these forecasts to dim skyscraper lights on high-migration nights, cutting bird collisions by an estimated 60–80%.
What it tells us about climate
Long radar archives — 25+ years — show that some species are migrating up to 2 weeks earlier than in the 1990s. This is one of the most precise climate-impact datasets in biology, and it comes from machines designed to track thunderstorms.
DIY radar ornithology
Anyone can download Level II NEXRAD data, run it through open tools like wsrlib or BirdCast viewers, and observe roost rings forming at sunrise around lakes and swamps. It is a strange and beautiful side door into ecology.
The Biological Signature: ZDR and Correlation
While standard reflectivity indicates the density of biomass in the air, dual-polarization radar uses the differential reflectivity (ZDR) and the coefficient of correlation (ρhv) to distinguish birds from other atmospheric phenomena. Because birds are non-spherical and typically fly in a horizontally oriented fashion, they create a distinct ZDR signature that differs significantly from circular rain droplets or tumbling hailstones. This allows ornithologists to filter out 'biological noise' and calculate the mean wingbeat frequency of a flock, often identifying whether the mass is composed of larger waterfowl or smaller passerines based on the signal's variance and the speed of the detected movement.
The shift from monochromatic to dual-polarization NEXRAD in the early 2010s was a watershed moment for the field. Before this, researchers struggled to separate insects—such as swarms of dragonflies or beetles—from bird signals. Now, the Cross-Correlation Coefficient (CC) serves as a filter; insects have lower correlation values due to their irregular shapes and high physical variability, while bird flocks maintain a more uniform electromagnetic return. This technical granularity has transformed radar from a simple detection tool into a precise taxonomic sensor capable of estimating the total number of individuals in a migration pulse with surprising accuracy.
Historical Origins: The 'Angels' of WWII
The discovery of radar ornithology was an accidental byproduct of military necessity during World War II. Early British radar operators noticed mysterious, ghost-like signals on their displays that moved at speeds inconsistent with known aircraft or weather patterns. These signals were initially labeled 'angels' because their source was invisible to the naked eye. In 1941, David Lack, a pioneer in the field, began correlating these radar echoes with visual observations, eventually proving that the 'angels' were actually migrating birds. This discovery initially faced skepticism from the military, which preferred to believe the signals were atmospheric interference or secret enemy technology.
It was not until the 1950s that the scientific community fully embraced radar as a census tool. Researchers began using surplus M33 fire-control radars to track individual birds, noticing that nocturnal migrants fly much higher than previously thought—often exceeding 2,000 meters. This historical foundation paved the way for modern WSR-88D applications. Today, the same principles used to detect incoming Luftwaffe bombers are utilized to protect endangered species, proving that a sensor designed for the battlefield can become one of the most powerful instruments for global conservation and the study of avian behavioral ecology.
The Ground Speed vs. Air Speed Calibration
A critical technical challenge in radar ornithology is distinguishing atmospheric wind drift from active avian flight. Radars measure ground speed, but biological insight requires calculating the bird's air speed—the effort the bird itself exerts. By integrating NEXRAD data with North American Mesoscale (NAM) wind models, researchers can subtract the ambient wind vector from the radar-tracked velocity. This reveals that many nocturnal migrants maintain a consistent 'airspeed' regardless of headwind or tailwind, a biological optimization that prevents exhaustion during trans-continental crossings.
This calibration also helps differentiate species groups. While most passerines fly at roughly 10 to 15 meters per second, larger waterfowl and shorebirds exhibit significantly higher airspeeds. Modern signal processing now utilizes the 'Doppler spread'—the variance in velocities within a single radar resolution volume—to estimate the diversity of a flock. A narrow spread suggests a uniform species migration, while a wide spread indicates a mixed-species wave, often seen during peak autumn movements when juveniles and adults travel together in disorganized pulses.
Density Thresholds and Biomass Estimation
Quantifying the number of birds from a radar reflectivity factor (Z) requires a conversion constant known as the radar cross-section (RCS). An average songbird has an RCS of approximately 10 to 20 square centimeters at S-band frequencies. By applying the 'sum of individual cross-sections' principle, scientists can calculate the bird density per cubic kilometer. On heavy nights, densities can exceed 500 birds per cubic kilometer. This mathematical framework allows the Cornell Lab to estimate that over 4 billion birds cross the U.S. borders annually, a figure previously impossible to verify with ground-based observers.
Reflectivity alone is not a perfect census tool because it doesn't account for bird mass or altitude distribution. To correct this, multi-radar mosaics are used to track the 'flight frame,' the vertical window between 500 and 3,000 meters where most migration occurs. Vertical Profiler Radars (VPR) confirm that birds favor specific isothermal layers where the air is densest and lift is most efficient. Without this vertical context, a radar bloom might suggest a small, dense flock, when it is actually a massive, diffused wave spanning several kilometers in altitude.