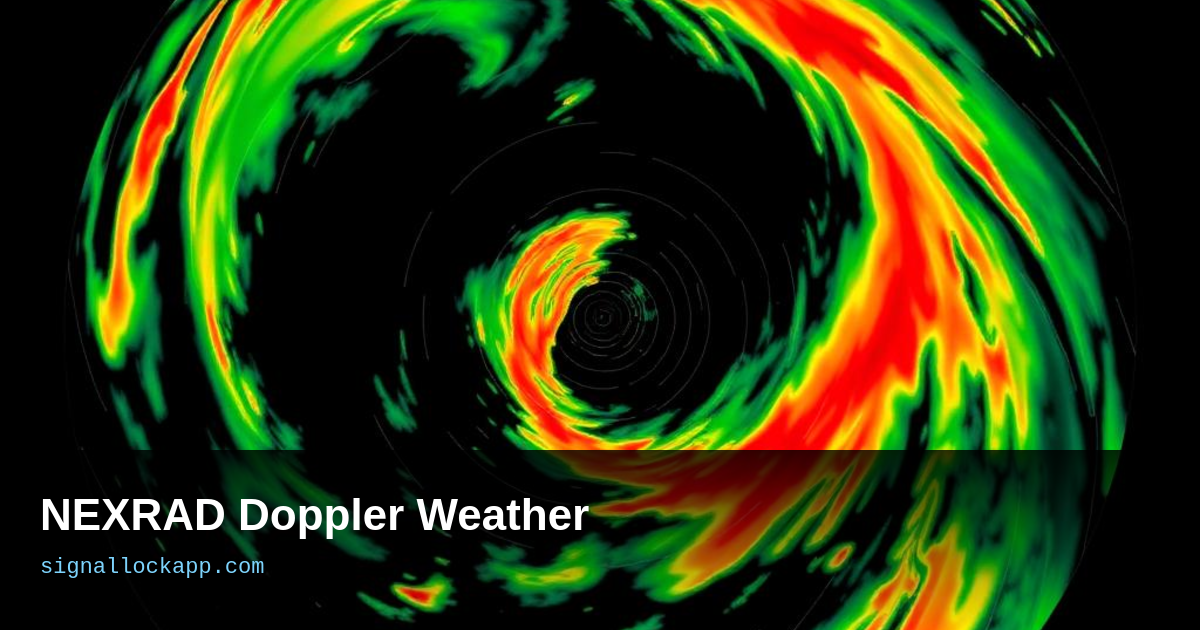
Doppler shift from hydrometeors
Raindrops, snowflakes and hailstones moving toward the radar compress the pulse frequency; those moving away stretch it. The WSR-88D measures this shift to 1 m/s precision across every range bin in a volume scan. Green usually means rain moving toward you; red means away. Where they touch, rotation — the tornado signature.
Reflectivity (dBZ)
The radar also measures how much energy bounces back — reflectivity, in decibels relative to Z (dBZ). Light rain: 20 dBZ. Heavy rain: 45 dBZ. Hail core: 60+ dBZ. Your weather app maps these to blue-green-yellow-red-magenta. A trained meteorologist can read storm severity from the colour scale in seconds.
Dual-polarisation upgrade
Since 2011, NEXRAD radars transmit both horizontal and vertical polarisation. Ellipsoidal raindrops reflect differently than spherical hailstones or flat snowflakes. Dual-pol improves rainfall estimates, distinguishes precipitation type, and detects debris balls — the lofted wreckage that confirms a tornado is on the ground.
From research to your phone
The first operational Doppler weather radar was installed in 1968. NEXRAD's 160-site network was completed in 1997. Today, data flows to apps in under 5 minutes. The supercell that spawned a tornado in Oklahoma is visible on your phone before the sirens sound.
The Pulse Repetition Frequency Dilemma
A critical constraint in weather radar operation is the compromise between range and velocity, known as the 'Doppler Dilemma.' Radars emit pulses at a specific rate called the Pulse Repetition Frequency (PRF). To detect distant storms, the radar must wait longer for the signal to return, requiring a low PRF. However, to accurately measure high-speed winds without 'aliasing'—a phenomenon where the velocity exceeds the radar's measurement limit and wraps around to show the opposite direction—a high PRF is necessary. NEXRAD sites manage this by alternating PRFs during a single volume scan, ensuring that both distant precipitation and localized high-velocity rotation are captured with minimal signal ambiguity.
When the PRF is too low for the wind speed, the radar data produces a 'velocity fold.' On a screen, this looks like a sudden jump from maximum inbound velocity (bright green) to maximum outbound velocity (bright red), even though the wind is moving in a single direction. Meteorologists use de-aliasing algorithms to correct these artifacts, but the physical limitation remains a fundamental challenge in radar engineering. Modern upgrades like the SZ-2 phase coding allow current systems to separate these overlapping signals more effectively than the original 1980s WSR-88D hardware, providing clearer imagery for early tornado warnings and aviation safety.
Ground Clutter and Anomalous Propagation
Not every colored pixel on a radar map represents precipitation. Standard NEXRAD sweeps encounter 'ground clutter,' which occurs when the radar beam strikes stationary objects like buildings, mountains, or wind turbines. Under normal atmospheric conditions, these echoes are filtered out based on their zero Doppler velocity. However, a phenomenon called Anomalous Propagation (AP) can complicate this. When a temperature inversion traps a layer of cold air near the ground, the radar beam bends downward—a process called super-refraction. This causes the beam to strike the ground far from the station, returning intense echoes that look like heavy rain or 'ghost storms' on static displays.
Differentiating between AP and actual rainfall requires the use of Correlation Coefficient (CC) data, a product of the dual-polarization era. Real raindrops have high CC values because they are uniform in shape, while ground clutter and biological targets—like massive swarms of migratory birds or insects—show low CC values due to their irregular physical profiles. Modern NEXRAD systems utilize the Clutter Mitigation Decision (CMD) algorithm, which automatically identifies and removes these non-weather artifacts in real-time. This ensures that the 'rainbow' seen by the public reflects atmospheric moisture rather than reflections from a distant hillside or a localized swarm of mayflies.
The Velocity Dealiasing Challenge
A critical limitation in Doppler interpretation is the Nyquist velocity, the maximum speed a radar can measure before the signal 'wraps around.' If a storm's wind speed exceeds this limit—often around 30 to 60 knots depending on the pulse repetition frequency—the radar may incorrectly display a high-speed wind moving toward the station as a slower wind moving away. This phenomenon, known as aliasing or velocity folding, creates visual artifacts where bright reds and greens appear jumbled. Meteorologists must apply dealiasing algorithms to 'unroll' these signals and reconstruct the true wind field of a rotating supercell or microburst.
The trade-off between range and velocity remains a constant technical hurdle. Increasing the pulse repetition frequency (PRF) allows for higher velocity measurements without aliasing, but it simultaneously reduces the unambiguous range the radar can see. If the PRF is too high, echoes from distant storms may return after the next pulse has already been sent, causing 'second-trip echoes' that appear as ghost-like purple or gray streaks on the map. Modern NEXRAD software uses complex pulsing schemes to mitigate these errors, ensuring that the velocity data displayed on public maps accurately represents the physical kinematics of the atmosphere.
The Correlation Coefficient and Debris Detection
Beyond simple reflectivity, the Correlation Coefficient (CC) serves as a vital metric for identifying non-meteorological targets. CC measures how similar the shapes of particles are within a specific volume of air. In a typical rain event, the CC value remains high—near 0.95 or 1.0—because raindrops are relatively uniform. However, when a tornado lofts irregular debris like wood, insulation, or metal into the sky, the CC value drops significantly below 0.80. This 'Tornado Debris Signature' (TDS) appears as a localized blue or dark spot on a correlation map, providing immediate confirmation of ground impact even at night.
This technical capability changed the nature of emergency warnings. Before the dual-polarization era, meteorologists relied solely on the 'hook echo' or velocity couplets to infer a tornado's presence. Now, by comparing the CC map with the reflectivity map, they can distinguish between a harmless swarm of insects, which produces low CC and low reflectivity, and a destructive debris ball, which produces low CC but extremely high reflectivity. This data-driven approach minimizes false alarms and provides higher confidence when issuing 'Tornado Emergency' declarations for populated areas, directly translating physical signal processing into saved lives.