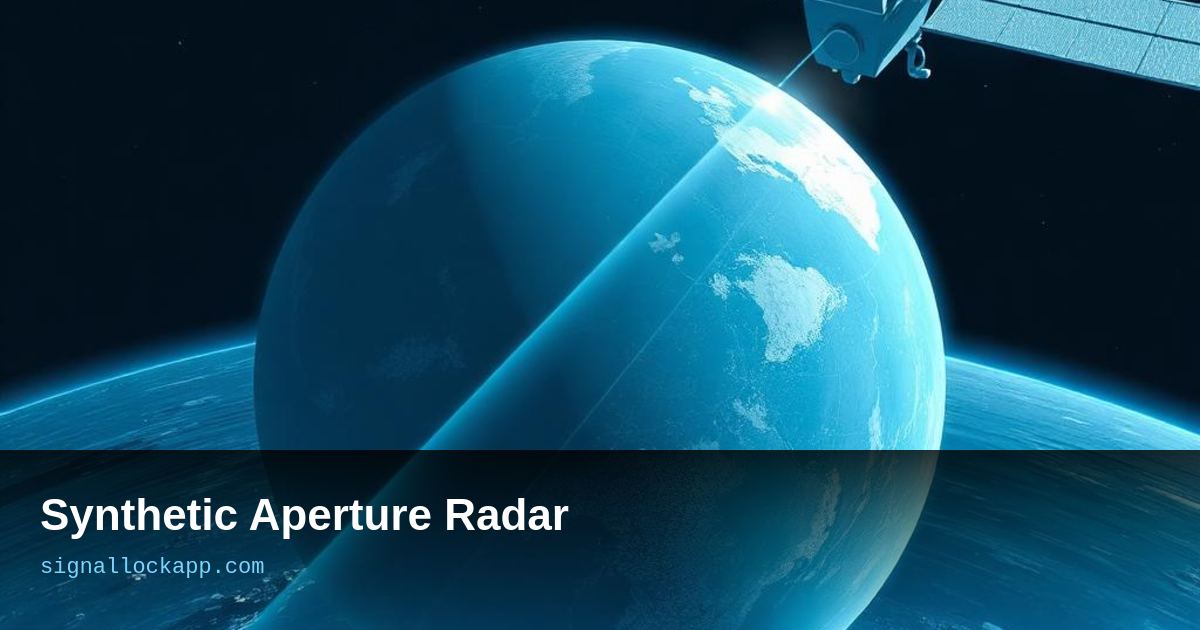
The synthetic-aperture trick
A satellite carrying a 10 m antenna at 7 km/s pulses radar at the ground. Over a few seconds it traverses a 10 km path. By coherently combining all the returns along that path, the data is processed as if it came from a single 10 km antenna — giving metre-scale resolution from orbit.
All weather, all night
SAR is radar — clouds, rain, smoke, polar night, none of it matters. The European Sentinel-1 satellites image the entire planet every 6 days at 5 m resolution. Glaciologists use it to measure ice flow centimetre by centimetre. Defence analysts use it to count tanks through cloud cover.
Interferometry (InSAR)
Take two SAR images of the same place weeks apart and compare phase. Differences as small as a few millimetres show up — perfect for measuring earthquake displacement, subsidence over abandoned mines, or a volcano slowly inflating before an eruption.
The new commercial wave
ICEYE, Capella Space and Umbra are launching small SAR satellites at high cadence. A site you care about can now be re-imaged in hours, not weeks. The technology that started with a 1978 NASA Seasat is becoming a commodity.
Frequency bands and penetration
SAR systems operate across different microwave bands, each offering unique physical interactions with the surface. X-band radar, at a wavelength of roughly 3 cm, reflects off the top of a forest canopy, making it ideal for monitoring leaf-level changes or urban structures. In contrast, L-band radar uses a 24 cm wavelength that penetrates through foliage to map the underlying ground or thick tree trunks. This transparency is critical for biomass estimation and detecting archaeological ruins hidden beneath dense tropical rainforests that optical sensors cannot see.
The choice of polarization—how the radar waves are oriented—further refines the data. By transmitting and receiving in horizontal or vertical planes (HH, VV, or cross-polarization), SAR can distinguish between rough water surfaces, smooth paved roads, and complex urban geometry. This multi-polarimetric approach allows scientists to categorize land use with high precision. While a visible light photo might show a green expanse, a quad-pol SAR data set identifies whether that green is a swamp, a cornfield, or a managed forest based on the bounce-back characteristics.
The challenge of speckle and lag
Raw SAR data is not an image; it is a complex phase history that requires massive computational power to reconstruct. One inherent artifact of this process is 'speckle,' a salt-and-pepper noise caused by the interference of waves reflecting from multiple small objects within a single resolution cell. Engineers mitigate this through 'multi-looking,' which averages multiple independent snapshots of the same area. This reduces the grainy appearance but comes at the cost of spatial resolution, forcing a constant engineering trade-off between image clarity and fine-grained detail.
Historically, processing this data was a bottleneck. In the 1970s, SEASAT data was processed using optical correlation with film and lenses because digital computers were too slow. Today, the shift toward real-time onboard processing allows satellites to detect changes—such as a ship entering a restricted zone—and transmit an alert instantly. This transition from retrospective research to live monitoring is what enables modern maritime security and rapid disaster response, turning what was once a slow scientific tool into a tactical asset.
The Pulse Compression Principle
To achieve high range resolution without requiring an impossibly powerful peak-power transmitter, SAR utilizes pulse compression, specifically the 'chirp' signal. Instead of a short, high-energy pulse, the radar emits a long, frequency-modulated signal that sweeps across a wide bandwidth. Upon reception, the radar processor applies a matched filter that compresses this long pulse back into a sharp spike. This allows the system to distinguish between objects just centimeters apart in the range direction while maintaining a manageable power profile for the satellite’s solar arrays.
This compression is conceptually similar to the way a camera's shutter speed works, but it operates in the frequency domain. By spreading the energy over time (the chirp) and then mathematically collapsing it (the compression), engineers bypass the fundamental hardware limitations of vacuum tube or solid-state amplifiers. This technique, combined with the Doppler shift processing that defines the azimuth resolution, ensures that the resulting imagery has the clarity needed for maritime surveillance or infrastructure monitoring regardless of the satellite's 700-kilometer altitude.
Polarimetry: Seeing the Geometry
While standard SAR measures backscatter intensity, polarimetric SAR (PolSAR) examines the orientation of the electromagnetic waves. By transmitting and receiving in both horizontal (H) and vertical (V) planes, satellites can identify the physical structure of a target. A 'double-bounce' return often indicates man-made structures with 90-degree angles, such as buildings or ships, while 'volume scattering' typically represents the complex, chaotic branches of a forest canopy. This allows for precise land-cover classification that goes far beyond simple grayscale imaging.
The shift to quad-polarization data sparked a revolution in environmental science during the early 2000s. For instance, the Canadian Radarsat-2 mission demonstrated that vertical polarized waves penetrate deeper into grain crops, while horizontal waves are more sensitive to soil moisture. By comparing these returns, analysts can now estimate biomass density and soil saturation across entire continents. This geometric 'fingerprinting' is what makes SAR an essential tool for flood mapping, as it can clearly distinguish between the smooth, dark signature of open water and the bright, disrupted returns of flooded urban areas.